
Part 5: Reading Sensor Values, Generating Graphics, and Displaying on the TFT
With your hardware successfully set up and operational, it’s time to configure the sensors to read values and store them in your database every 5 minutes. You have the flexibility to adjust the reading frequency to your preference, be it every 15 minutes, hourly, four times daily, or any other interval. Keep in mind that the database size increases with more frequent data storage. Personally, I opted for a 5-minute interval, considering periodic data dumps and truncating the database if performance slows down, allowing a fresh start.
The next step involves running the software periodically to read sensors and store the data. Typically, I create a system service running in the background with systemd. Alternatively, you can use a cronjob to execute a script or program at designated intervals—minutes, hours, or days.
I lean towards system services due to their ease of initiation, restart, monitoring, and inherent logging capabilities. On a modest Raspberry Pi with only 512 MB RAM, minimizing processes in memory is preferable. The sensor scripts run for a few seconds and then stop, making it a straightforward and somewhat stable process that doesn’t need constant attention. Since image creation and the slideshow run continuously, I set them up as services.
The script for sensor readout resides in /home/axel/dev/bme688screen as the file bme688_ds18b20.py. To execute this script every 5 minutes, add a cronjob with the following command:
crontab -eAdd the following line (customize with your changes and directory or filenames) at the end of the file:
*/5 * * * * python /home/axel/dev/bme688screen/bme688_ds18b20.py > /dev/null 2>&1Save and exit the crontab with CTRL-O, CTRL-X.
This line instructs the cron-daemon to execute your script with Python every 5 minutes. The “/dev/null 2>&1” at the end suppresses any output the program would generate. Since the cron-daemon doesn’t require this output and it would inundate your system email box.
Now, let’s read the values and generate images for display.
After storing the temperatures and other values in our database, making them accessible within our network, we retrieve them to create a series of pictures for a delightful slideshow on the compact TFT. For the 2.8-inch ILI9341, pictures need a resolution of 320 by 240. Certain values will be displayed using a color scheme for quick comprehension. Temperatures, for instance, will show in blue, light blue, light green, green, orange, and red, indicating the current indoor and outdoor temperature range.
Firstly, install a graphics library for your Python program by typing:
pip install PillowNow, create a file named makeimages_temp.py:
nano makeimages_temp.pyCopy and paste the following code into this file:
import os
import logging
from PIL import Image, ImageDraw, ImageFont
import mysql.connector
from mysql.connector import Error
import datetime
logging.basicConfig(filename='/var/log/makeimages2.py.log', level=logging.DEBUG)
logging.info('Das Skript wurde gestartet')
# Verbindung zur Datenbank herstellen
try:
connection = mysql.connector.connect(
host="192.168.x.y",
user="dbuser",
password="password",
database="sensor_data"
)
if connection is not None and connection.is_connected():
cursor = connection.cursor(dictionary=True)
cursor.execute("SELECT * FROM sensor_data2 ORDER BY date2 DESC, time2 DESC LIMIT 1")
row = cursor.fetchone()
if row:
last_temperature = row["Innentemperatur2"]
last_pressure = row["Luftdruck2"]
last_humidity = row["Feuchtigkeit2"]
air_quality = row["AirQuality2"]
air_quality_scale = row["AirQualityScale2"]
date_time = f"{row['date2']} {row['time2']}"
# Schriftart und Größe festlegen
font = ImageFont.truetype("/home/axel/dev/bme688screen/fonts/Roboto-Regular.ttf", 24)
font_big = ImageFont.truetype("/home/axel/dev/bme688screen/fonts/Roboto-Regular.ttf", 60)
font_large = ImageFont.truetype("/home/axel/dev/bme688screen/fonts/Roboto-Bold.ttf", 96)
font_small = ImageFont.truetype("/home/axel/dev/bme688screen/fonts/Roboto-Regular.ttf", 18)
font_units = ImageFont.truetype("/home/axel/dev/bme688screen/fonts/Roboto-Thin.ttf", 16) # Schrift für Einheiten (kleiner)
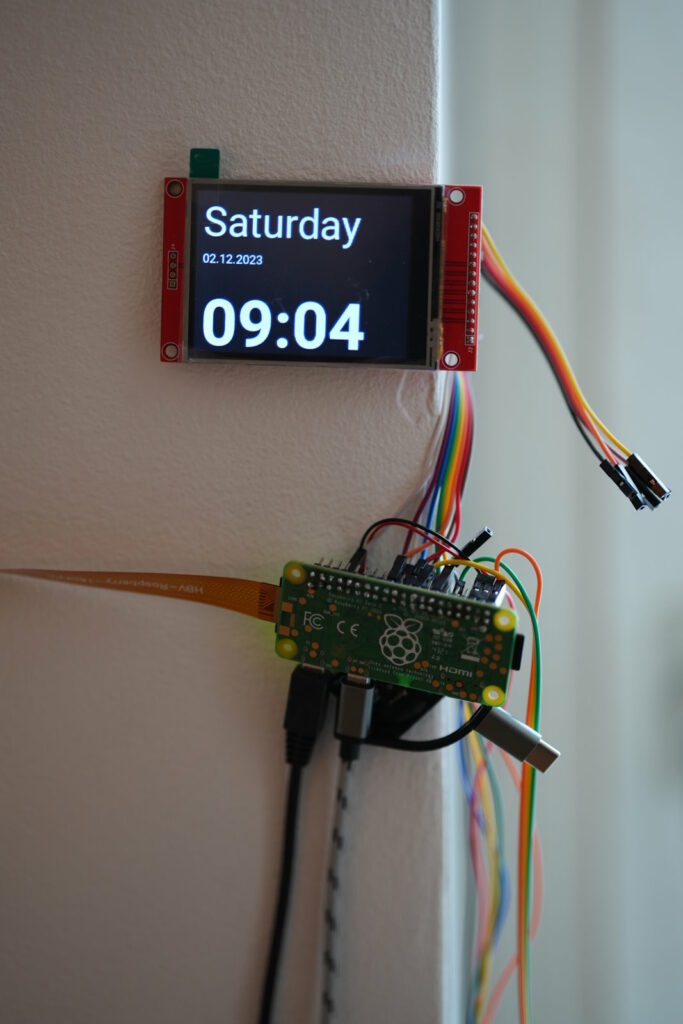
# Erstes Bild mit Wochentag, Datum und Uhrzeit erstellen
img = Image.new('RGB', (320, 240), color='black')
draw = ImageDraw.Draw(img)
current_datetime = datetime.datetime.now()
day_of_week = current_datetime.strftime("%A")
date = current_datetime.strftime("%d.%m.%Y")
time = current_datetime.strftime("%H:%M")
draw.text((10, 10), day_of_week, fill='white', font=font_big)
draw.text((10, 90), date, fill='white', font=font_small)
draw.text((10, 140), time, fill='white', font=font_large)
img.save("/home/axel/dev/bme688screen/images/image_4.png")
# Luftqualitätsgrafik erstellen
img = Image.new('RGB', (320, 240), color='black')
draw = ImageDraw.Draw(img)
# Farben für die Luftqualität definieren
luftqualitaet_farben = {
"Sehr gute Luftqualität": (0, 255, 0), # Grün
"Gute Luftqualität": (144, 238, 144), # Hellgrün
"Moderate Luftqualität": (255, 255, 0), # Gelb
"Schlechte Luftqualität": (255, 165, 0), # Orange
"Sehr schlechte Luftqualität": (255, 0, 0) # Rot
}
# Hintergrund und Textfarbe basierend auf Luftqualität setzen
background_color = (0, 0, 0) # Schwarz
text_color = luftqualitaet_farben.get(air_quality_scale, (255, 255, 255)) # Weiß als Standard
# Texte für Luftqualität erstellen
air_quality_text_1 = "Luftqualität:"
air_quality_text_2 = air_quality_scale
air_quality_text_3 = f"{int(air_quality)}"
unit_text = ""
# Texte auf Bild zeichnen
draw.rectangle([(0, 0), (320, 240)], fill=background_color)
draw.text((10, 10), air_quality_text_1, fill='white', font=font)
draw.text((10, 40), air_quality_text_2, fill=text_color, font=font)
draw.text((10, 80), air_quality_text_3, fill=text_color, font=font_large)
img.save("/home/axel/dev/bme688screen/images/image_air_quality.png")
# Luftfeuchtigkeitsgrafik erstellen
img = Image.new('RGB', (320, 240), color='black')
draw = ImageDraw.Draw(img)
# Aussentemperatur abrufen
external_temperature = row["Aussentemperatur2"]
# Grafik für Aussentemperatur erstellen
img = Image.new('RGB', (320, 240), color='black')
draw = ImageDraw.Draw(img)
temperature_ranges = [(-100, -15), (-15, -5), (-5, 0), (0, 5), (5, 10), (10, 15), (15, 20), (20, 25), (25, 30),
(30, 35), (35, 100)]
colors = [(0, 0, 208), (0, 0, 255), (173, 216, 230), (173, 216, 230), (255, 255, 255), (0, 255, 60),
(60, 218, 0), (255, 185, 0), (255, 99, 0), (255, 60, 0), (139, 0, 0)]
temperature_color = (0, 0, 0) # Default-Farbe (schwarz)
for temp_range, color in zip(temperature_ranges, colors):
if temp_range[0] <= external_temperature <= temp_range[1]:
temperature_color = color
break
temperature_text = "Aussentemperatur: "
unit = "°C"
draw.text((10, 10), temperature_text, fill='white', font=font)
value_text = f"{external_temperature:.2f}"
unit_text = f"{unit}"
value_bbox = draw.textbbox((10, 80), value_text, font=font_large)
unit_bbox = draw.textbbox((value_bbox[2], 80), unit_text, font=font_units)
total_width = unit_bbox[2]
draw.text((10 + (320 - total_width) / 2, 80), value_text, fill=temperature_color, font=font_large)
draw.text((10 + (320 - total_width) / 2 + value_bbox[2], 80), unit_text, fill='white', font=font_units)
img.save("/home/axel/dev/bme688screen/images/image_external_temperature.png")
# Weitere Bilder wie zuvor erstellen
for i, (label, value, unit) in enumerate([
("Temperatur:", last_temperature, "°C"),
("Luftdruck:", last_pressure, "hPa"),
("Feuchtigkeit:", last_humidity, "%")
]):
img = Image.new('RGB', (320, 240), color='black')
draw = ImageDraw.Draw(img)
if label == "Temperatur:":
temperature_ranges = [(-100, -15), (-15, -5), (-5, 0), (0, 5), (5, 10), (10, 15), (15, 20), (20, 25),
(25, 30), (30, 35), (35, 100)]
colors = [(0, 0, 208), (0, 0, 255), (173, 216, 230), (173, 216, 230), (255, 255, 255), (0, 255, 60),
(60, 218, 0), (255, 185, 0), (255, 99, 0), (255, 60, 0), (139, 0, 0)]
temperature_color = (0, 0, 0) # Default-Farbe (schwarz)
for temp_range, color in zip(temperature_ranges, colors):
if temp_range[0] <= value <= temp_range[1]:
temperature_color = color
break
temperature_text = f"Temperatur: "
unit = "°C"
draw.text((10, 10), label, fill='white', font=font)
value_text = f"{value:.2f}"
unit_text = f"{unit}"
value_bbox = draw.textbbox((10, 80), value_text, font=font_large)
unit_bbox = draw.textbbox((value_bbox[2], 80), unit_text, font=font_units)
total_width = unit_bbox[2]
draw.text((10 + (320 - total_width) / 2, 80), value_text, fill=temperature_color, font=font_large)
draw.text((10 + (320 - total_width) / 2 + value_bbox[2], 80), unit_text, fill='white',
font=font_units)
img.save(f"/home/axel/dev/bme688screen/images/image_{i + 1}.png")
else:
draw.text((10, 10), label, fill='white', font=font)
value_text = f"{value:.2f}"
unit_text = f"{unit}"
value_bbox = draw.textbbox((10, 80), value_text, font=font_large)
unit_bbox = draw.textbbox((value_bbox[2], 80), unit_text, font=font_units)
total_width = unit_bbox[2]
draw.text((10 + (320 - total_width) / 2, 80), value_text, fill='white', font=font_large)
draw.text((10 + (320 - total_width) / 2 + value_bbox[2], 80), unit_text, fill='white',
font=font_units)
img.save(f"/home/axel/dev/bme688screen/images/image_{i + 1}.png")
except Error as e:
print(f"Fehler bei der Datenbankverbindung: {e}")
finally:
if connection.is_connected():
cursor.close()
connection.close()
Save and exit the file with CTRL-O, CTRL-X. This compact program now generates five images named image_1.png to image_5.png, each featuring relevant sensor values sourced from the database. Adjust paths, directories, texts, and colors in this script to align with your preferences and language.
Create a dedicated folder to store the images:
mkdir imagesAdditionally, you may want to download fonts for your program. Place them in a folder named “fonts” and adjust the font path and file names in the script accordingly. You can find appealing fonts on Google Fonts: https://fonts.google.com/
Now, test the program by running:
python ./makeimages_temp.pyAs a bonus, I fetch current weather conditions and forecasts for the next 5 days at a 3-hour interval. A small weather icon picture is also generated and included in the slideshow. However, this will be covered in a subsequent guide.
Showtime – Now, let’s get some code for a straightforward JPEG slideshow on the TFT.
As a preliminary step, install pigpio and the corresponding Python libraries for dim control. Since one terminal is in the bedroom and another in the hallway, I dim the displays overnight and in the evenings and mornings to ensure undisturbed sleep. Enter the following in your console:
pip install pigpioThis installs the pigpio Python library, enabling our show program to control the backlight pin with PWM signals for brightness adjustment between 1 and 100%.
Next, we need another program as a subprocess. “fbi” is a framebuffer image viewer that can be installed with apt:
apt install fbiCreate a new file:
nano framebuffer_show_dim.pyCopy and paste the following text into it:
import os
import subprocess
import time
import pigpio
from datetime import datetime

# GPIO-Pin für PWM-Steuerung des Backlights
backlight_pin = 13

# PWM-Objekt erstellen
pi = pigpio.pi()

def get_files_in_directory(directory):
    files = []
    for f in os.listdir(directory):
        file_path = os.path.join(directory, f)
        if os.path.isfile(file_path):
            files.append(file_path)
    return files

def file_exists(file_path):
    return os.path.exists(file_path)

def get_oldest_file(directory):
    files = get_files_in_directory(directory)
    if not files:
        return None
    return min(files, key=lambda f: os.path.getctime(os.path.join(directory, f)))

def display_image(image_path, framebuffer_device):
    try:
        print(f"Anzeige von Bild: {image_path}")

        # Überprüfen, ob die Datei existiert, bevor sie angezeigt wird
        if file_exists(image_path):
            subprocess.Popen(['fbi', '-d', framebuffer_device, '-T', '1', '-noverbose', '-a', image_path])
            print("Anzeige erfolgreich.")
        else:
            print("Die Datei existiert nicht.")

    except Exception as e:
        print(f"Fehler beim Anzeigen des Bildes: {e}")

def set_pwm_duty_cycle(current_hour):
    # Zeitsteuerung für PWM-Duty-Cycle
    if 0 <= current_hour < 6:
        pi.set_PWM_dutycycle(backlight_pin, 5)
    elif 6 <= current_hour < 7:
        pi.set_PWM_dutycycle(backlight_pin, 20)
    elif 7 <= current_hour < 9:
        pi.set_PWM_dutycycle(backlight_pin, 50)
    elif 9 <= current_hour < 18:
        pi.set_PWM_dutycycle(backlight_pin, 100)
    elif 18 <= current_hour < 21:
        pi.set_PWM_dutycycle(backlight_pin, 70)
    elif 21 <= current_hour < 23:
        pi.set_PWM_dutycycle(backlight_pin, 20)
    else:
        pi.set_PWM_dutycycle(backlight_pin, 5)

def main(image_directory, framebuffer_device):
    displayed_images = set()

    try:
        while True:
            files = get_files_in_directory(image_directory)

            if files:
                for file in files:
                    image_path = os.path.join(image_directory, file)

                    # Überprüfen, ob das Bild bereits angezeigt wurde
                    if image_path not in displayed_images and time.time() - os.path.getctime(image_path) > 2:
                        # Dimmzeit für die aktuelle Stunde überprüfen
                        current_hour = datetime.now().hour
                        set_pwm_duty_cycle(current_hour)

                        # Bild anzeigen, wenn es existiert
                        if file_exists(image_path):
                            display_image(image_path, framebuffer_device)

                            # Angezeigtes Bild und PWM-Duty-Cycle speichern
                            displayed_images.add(image_path)

                            # Warten
                            time.sleep(3)
                        else:
                            print(f"Die Datei {image_path} existiert nicht.")

            else:
                print("Keine Bilder im Verzeichnis gefunden.")
                time.sleep(1)

            # Beende alle laufenden fbi-Prozesse
            subprocess.run(['pkill', 'fbi'])

            # Warten und dann die Liste der angezeigten Bilder zurücksetzen
            time.sleep(1)
            displayed_images.clear()

    except KeyboardInterrupt:
        print("\nProgramm wurde beendet.")
        # Beende alle laufenden fbi-Prozesse
        subprocess.run(['pkill', 'fbi'])

        # PWM beenden
        pi.set_PWM_dutycycle(backlight_pin, 0)
        pi.stop()

if __name__ == "__main__":
    image_directory = "/home/axel/dev/bme688screen/images/"
    framebuffer_device = "/dev/fb1"

    main(image_directory, framebuffer_device)
In this code, there is also the timing plan for the display dimming in a 24 hour display. Change it according to you needs:
def set_pwm_duty_cycle(current_hour):
# Zeitsteuerung für PWM-Duty-Cycle
if 0 &lt;= current_hour &lt; 6:
pi.set_PWM_dutycycle(backlight_pin, 5)
elif 6 &lt;= current_hour &lt; 7:
pi.set_PWM_dutycycle(backlight_pin, 20)
elif 7 &lt;= current_hour &lt; 9:
pi.set_PWM_dutycycle(backlight_pin, 50)
elif 9 &lt;= current_hour &lt; 18:
pi.set_PWM_dutycycle(backlight_pin, 100)
elif 18 &lt;= current_hour &lt; 21:
pi.set_PWM_dutycycle(backlight_pin, 70)
elif 21 &lt;= current_hour &lt; 23:
pi.set_PWM_dutycycle(backlight_pin, 20)
else:
pi.set_PWM_dutycycle(backlight_pin, 5)
Save and exit the file with CTRL-O, CTRL-X.
Assuming everything is configured correctly and images have been created, we are now ready to launch an impressive slideshow on the tiny TFT display. Test the framebuffer slideshow with the following command:
python framebuffer_show_dim.pyIf your display shows text and values, we are almost done! Cancel the program with CTRL-C and let’s create two system services that run image generation every minute. Since we also display date and time on one of the pictures, it makes sense to ensure the correct minute is shown. The framebuffer slideshow is a continuous loop that displays pictures, scans the image folder for new pictures, and only shows them when they are not still being written.
I’ve created a bash script for better control over individual image generations (sensor values and forecast pictures) on the Raspberry. For now, this bash script only calls one process. In case you wonder why there is only one execution in it, I will cover the icon generation with the weather forecast in a later guide.
Type in your console
nano bash_imagemake.shand add the following lines into it:
#!/bin/bash
while true
do
sleep 57
python /home/axel/dev/bme688screen/makeimages_temp.py
sleep 3
done
Save and exit with CTRL-O, CTRL-X.
Type in your console:
cd /lib/systemd/systemand add a file:
nano weatherimage.serviceCopy/paste this into it and change your paths and settings accordingly:
[Unit]
Description=Weather Image Maker
After=stream.service
[Service]
ExecStartPre=/bin/sleep 5
ExecStart=/home/axel/dev/bme688screen/bash_imagemake.sh
Nice=15
Restart=always
User=root
WorkingDirectory=/home/axel/dev/bme688screen
[Install]
WantedBy=multi-user.target
Now create another file:
nano weatherscreen.serviceand add the following content:
[Unit]
Description=Weatherscreen
After=weatherimage.service
[Service]
ExecStartPre=/bin/sleep 10
ExecStart=/usr/bin/python3 /home/axel/dev/bme688screen/framebuffer_show_dim.py
Nice=15
Restart=always
User=root
WorkingDirectory=/home/axel/dev/bme688screen
[Install]
WantedBy=multi-user.target
Save and exit with CTRL-O, CTRL-X.
Now start and enable the services during system boot:
systemctl enable weatherimages.service
systemctl enable weatherscreen.service
systemctl start weatherimages.service
systemctl start weatherscreen.service
And there we have it! You should now have a fully functional Raspberry Zero 2W with sensor readout, database storing, image generation, and slideshow display on a 2.8-inch TFT display. It might come with a bit of cable chaos, bewildered looks from your spouse, and curious questions from your kids, while it’s hanging on your wall close to a window. 🙂
In some follow-up guides, I’ll be sharing my codes on how to showcase all this data on your personal website. I’ll cover adding forecast data from openweathermap.org, incorporating a picture transcoder that supports various source formats and downscales them to 320×240 for your ILI9341 slideshow. Additionally, I’ll guide you on how to conveniently control EQ3 Bluetooth thermostats for your heating batteries using a user-friendly timetable that you can edit directly on a website. Stay tuned for more exciting insights!
Please keep in mind that I also have additional services running on that same Pi, so you might wonder why I do things like this and not in a “simpler” way. My code also contains loops where I actually do not need them here, but I use them internally for debugging or other reasons that I will address in a later guide. I equipped the code with a lot of convenience aspects, RAM and CPU-saving parts, and some access for other software. That might have caused non-logical parts in the code that might not make too much sense in this guide. Please correct or delete those parts, and feel free to share code improvements, features, and enhancements with me. And return to “home” 🙂