
Climate control system – module 2 Having gathered data from both the BME680 or BME688 and DS18B20 TO-92 sensors using our Raspberry Pi, the next step is to retrieve and present this information on a
Climate control system – module 2
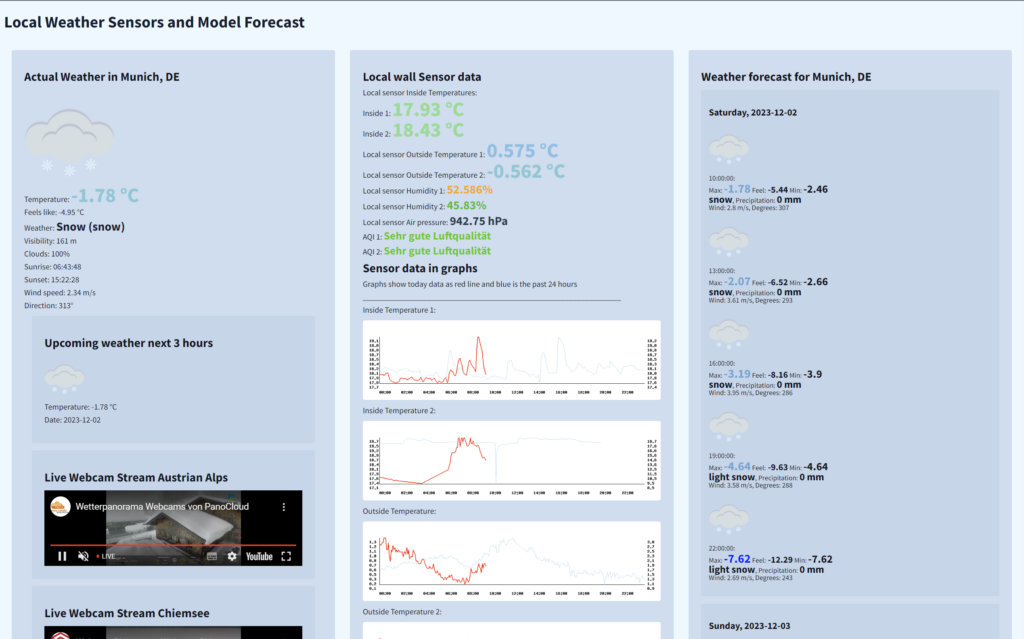
Having gathered data from both the BME680 or BME688 and DS18B20 TO-92 sensors using our Raspberry Pi, the next step is to retrieve and present this information on a website. The demonstration website will exhibit the most recent readings and feature a set of graphs depicting data for the current day and the previous day. Furthermore, a long-term graph will be displayed, illustrating the accumulated data on temperature, humidity, air pressure, gas resistance, and air quality from the MySQL database.
The website incorporates CSS styles, a Google font, a favicon.png, and employs div boxes to structure various containers. It establishes a connection to the sensor_data database from module one through MySQL. Additionally, several PHP scripts are utilized to generate and display graphs on the website. Indeed, this approach provides a straightforward and effective means to visualize the collected data.
Assuming you’ve already set up your MySQL database to store sensor data and have experience configuring an Apache2 webserver with PHP, following a LAMP stack approach, is crucial at this stage. If you haven’t done this yet, you can find helpful instructions on installations via resources like:
Given our decentralized setup with sensors and an existing database, it’s worth noting that the Apache2 webserver does not necessarily need to run on the Raspberry Pi. It could be hosted on any server, cloud-based or local, such as your home server or desktop computer. While I haven’t tested it on a Raspberry Pi Zero 2W, it should be feasible since the data volume is currently manageable. A Raspberry model 3 or 4 should manage this easily.
Let’s generate a few PHP files.
Head over to your Apache2 document root, usually /var/www/html
cd /var/www/htmlnano air.phpCopy and paste the following text into your text editor
(If you prefer to skip the manual file copying process, scroll down in this article and conveniently download all the necessary files from wetransco.de.)
<!DOCTYPE html>
<html>
<head>
<link rel="icon" href="favicon.png" type="image/png">
<link rel="stylesheet" href="https://fonts.googleapis.com/css?family=Source Sans Pro:400,700">
<title>temperature, air pressure and humidity graphs</title>
<style>
@font-face {
font-family: Source Sans Pro;
}
body {
font-family: Source Sans Pro, monospace;
color: #efd6d1;
background-color: rgba(44, 62, 80, 0.9);
display: flex;
flex-wrap: wrap;
justify-content: flex-start;
border-radius: 4px; /* Abrundung der Ecken */
}
.chart-container, .wide-chart-container {
background-color: rgba(4, 8, 16, 0.2);
max-width: 100%;
height: auto;
color: #ecf0f1;
border-radius: 4px; /* Abrundung der Ecken */
margin: 5px;
padding: 10px;
box-sizing: border-box;
float: left;
width: calc(33.33% - 10px); /* 33.33% for three boxes */
}
.chart-container img {
background-color: rgba(4, 8, 16, 0.2);
max-width: 100%;
height: auto;
border-radius: 4px; /* Abrundung der Ecken */
}
.text {
background-color: rgba(4, 8, 16, 0.2);
max-width: 100%;
height: auto;
border-radius: 4px; /* Abrundung der Ecken */
}
.wide-chart-container {
width: 100%;
clear: both;
font-color: color: #efd6d1;
background-color: rgba(4, 8, 16, 0.2);
margin: 10px;
padding: 10px;
border-radius: 4px; /* Abrundung der Ecken */
box-sizing: border-box;
}
.wide-chart-container img {
background-color: rgba(4, 8, 16, 0.2);
max-width: 100%;
border-radius: 4px; /* Abrundung der Ecken */
height: auto;
}
@media (max-width: 800px) {
.chart-container, .wide-chart-container {
width: calc(100% - 10px);
clear: both;
}
}
</style>
</head>
<body>
<div>
<div class="text">
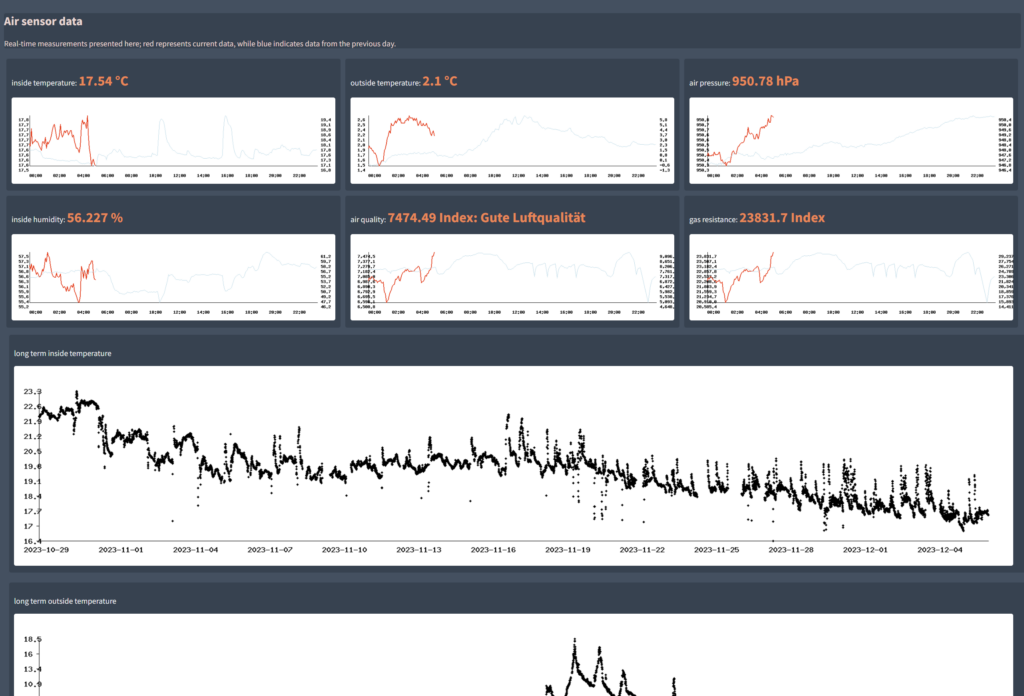
<h2>Air sensor data</h2>
<p>Real-time measurements presented here; red represents current data, while blue indicates data from the previous day.</p>
</div>
<?php
// Verbindung zur Datenbank herstellen
$servername = "192.168.y.x";
$username = "dbuser";
$password = "password";
$dbname = "sensor_data";
$conn = new mysqli($servername, $username, $password, $dbname);
// Überprüfen, ob die Verbindung erfolgreich hergestellt wurde
if ($conn->connect_error) {
die("Verbindung zur Datenbank fehlgeschlagen: " . $conn->connect_error);
}
// SQL-Abfrage, um den letzten Datensatz abzurufen
$sql = "SELECT Innentemperatur, Aussentemperatur, AirQuality, Gaswiderstand, AirQualityScale, Luftdruck, Feuchtigkeit, date, time FROM sensor_data ORDER BY date DESC, time DESC LIMIT 1";
$result = $conn->query($sql);
if ($result->num_rows > 0) {
$row = $result->fetch_assoc();
?>
<div class="chart-container">
<p>inside temperature: <span style="font-size: 21pt; color: #FF7F50; font-weight: bold;"> <?php echo $row["Innentemperatur"]; ?> °C</span></p>
<img src="temperature_graph.php" alt="Temperaturegraph" width="800" height="400">
</div>
<div class="chart-container">
<p>outside temperature: <span style="font-size: 21pt; color: #FF7F50; font-weight: bold;"> <?php echo $row["Aussentemperatur"]; ?> °C</span></p>
<img src="outtemperature_graph.php" alt="OutTemperaturegraph" width="800" height="400">
</div>
<div class="chart-container">
<p>air pressure: <span style="font-size: 21pt; color: #FF7F50; font-weight: bold;"><?php echo $row["Luftdruck"]; ?> hPa</span></p>
<img src="airpressure_graph.php" alt="Airpressuregraph" width="800" height="400">
</div>
<div class="chart-container">
<p>inside humidity: <span style="font-size: 21pt; color: #FF7F50; font-weight: bold;"><?php echo $row["Feuchtigkeit"]; ?> %</span></p>
<img src="humidity_graph.php" alt="Humiditygraph" width="800" height="400">
</div>
<div class="chart-container">
<p>air quality: <span style="font-size: 21pt; color: #FF7F50; font-weight: bold;"> <?php echo $row["AirQuality"]; ?> Index: <?php echo $row["AirQualityScale"]; ?></span></p>
<img src="airquality_graph.php" alt="AirQualitygraph" width="800" height="400">
</div>
<div class="chart-container">
<p>gas resistance: <span style="font-size: 21pt; color: #FF7F50; font-weight: bold;"> <?php echo $row["Gaswiderstand"]; ?> Index</span></p>
<img src="gasresistance_graph.php" alt="Gasresistancegraph" width="800" height="400">
</div>
<?php
}
$conn->close();
?>
<div class="wide-chart-container">
<p>long term inside temperature</p>
<img src="long_temperature_graph.php" alt="Temperaturegraph" width="2000" height="400">
</div>
<div class="wide-chart-container">
<p>long term outside temperature</p>
<img src="long_outtemperature_graph.php" alt="OutTemperaturegraph" width="2000" height="400">
</div>
<div class="wide-chart-container">
<p>long term air pressure</p>
<img src="long_airpressure_graph.php" alt="Pressuregraph" width="2000" height="400">
</div>
<div class="wide-chart-container">
<p>long term inside humidity</p>
<img src="long_humidity_graph.php" alt="Humiditygraph" width="2000" height="400">
</div>
<div class="wide-chart-container">
<p>long term air quality</p>
<img src="long_airquality_graph.php" alt="Airqualitygraph" width="2000" height="400">
</div>
<div class="wide-chart-container">
<p>long term gas resistance</p>
<img src="long_gasresistance_graph.php" alt="Humiditygraph" width="2000" height="400">
</div>
</div>
</body>
</html>
Adjust the database, dbuser, password, and IP address to match your specific setup. The website should currently display some text and numbers, but the graphs are yet to be incorporated.
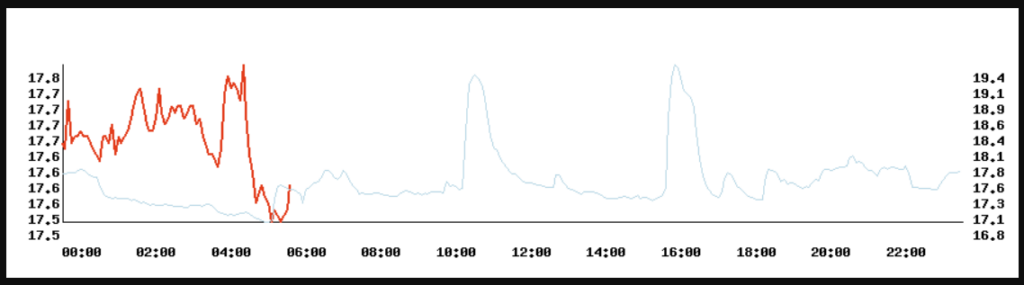
Graphs hold greater visual appeal than a cluster of numbers. Therefore, our next step involves re-reading the database and generating graphical images using a set of PHP scripts. Let’s begin with the inside temperature data from the BME68x sensor.
nano temperature_graph.phpCopy and paste the following lines into your temperature_graph.php and adjust IP address, dbuser, password to your setup, also in all the following files:
<?php
$servername = "192.168.y.x";
$username = "dbuser";
$password = "password";
$dbname = "sensor_data";

// Verbindung zur Datenbank herstellen
$conn = new mysqli($servername, $username, $password, $dbname);

// Überprüfen, ob die Verbindung erfolgreich war
if ($conn->connect_error) {
    die("Verbindung zur Datenbank fehlgeschlagen: " . $conn->connect_error);
}

// Datum für den aktuellen Tag
$currentDate = date("Y-m-d");

// SQL-Abfrage, um alle relevanten Daten für den aktuellen Tag abzurufen
$sql = "SELECT time, Innentemperatur FROM sensor_data WHERE date = '$currentDate' ORDER BY time";

$result = $conn->query($sql);

if ($result->num_rows > 0) {
    // Daten sammeln
    while ($row = $result->fetch_assoc()) {
        $data[] = array(
            'time' => date("H:i", strtotime($row['time'])),
            'temperature' => floatval($row['Innentemperatur'])
        );
    }

    // GD-Bild erstellen
    $width = 900; // Breite des Graphen
    $height = 240; // Höhe des Graphen
    $img = imagecreatetruecolor($width, $height);

    // Hintergrundfarbe festlegen
    $background = imagecolorallocate($img, 255, 255, 255);
    imagefilledrectangle($img, 0, 0, $width, $height, $background);

    // Linienfarben
    $lineColor = imagecolorallocate($img, 255, 0, 0);
    $axisColor = imagecolorallocate($img, 0, 0, 0); // Schwarze Achsen

    // Achsen zeichnen
    imageline($img, 50, 50, 50, $height - 50, $axisColor); // Vertikale Achse
    imageline($img, 50, $height - 50, $width - 50, $height - 50, $axisColor); // Horizontale Achse

    // Basisfrequenz für die Beschriftung (zum Beispiel alle 3 Stunden)
    $baseLabelFrequency = 28;

    // Initialisiere die LabelFrequency mit der Basisfrequenz
    $xLabelFrequency = $baseLabelFrequency;

    // Beschriftung der x-Achse (Zeit)


$dayStart = strtotime($currentDate . ' 00:00:00');
$dayEnd = strtotime($currentDate . ' 23:59:59');
$xLabelFrequency = 2;

for ($timestamp = $dayStart; $timestamp <= $dayEnd; $timestamp += $xLabelFrequency * 3600) {
    $x = 50 + ($timestamp - $dayStart) / (24 * 60 * 60) * ($width - 100); // Anpassung auf 24 Stunden
    imagestring($img, 3, $x, $height - 30, date("H:i", $timestamp), $axisColor);
}

/*
    $numDataPoints = count($data);

    for ($i = 0; $i < $numDataPoints; $i += $xLabelFrequency) {
        $timestamp = strtotime($currentDate . ' ' . $data[$i]['time']);

        // Berechne die Stunde aus dem Zeitstempel
        $hour = date('G', $timestamp);

        // Überprüfe die Uhrzeit und passe die LabelFrequency an
        if ($hour % $baseLabelFrequency === 0) {
            $xLabelFrequency = $baseLabelFrequency;
        } else {
            $xLabelFrequency = $baseLabelFrequency - ($hour % $baseLabelFrequency);
        }

        $x = 50 + ($timestamp - strtotime($currentDate)) / (24 * 60 * 60) * ($width - 100); // Anpassung auf 24 Stunden
        imagestring($img, 3, $x, $height - 30, date("H:i", $timestamp), $axisColor);
    }
*/

    // Beschriftung der y-Achse (Temperatur) für den aktuellen Tag
    $maxTemperature = max(array_column($data, 'temperature'));
    $minTemperature = min(array_column($data, 'temperature'));
    $temperatureRange = $maxTemperature - $minTemperature;
    $yLabelFrequency = $temperatureRange / 10; // 10 Temperaturwerte auf der y-Achse

    for ($i = 0; $i <= 10; $i++) {
        $y = $height - 50 - ($i * ($height - 100) / 10);
        $label = number_format($minTemperature + $i * $yLabelFrequency, 1);
        imagestring($img, 3, 20, $y + 5, $label, $axisColor);
    }
    // Temperaturwerte zeichnen für den aktuellen Tag
    $values = array();
    foreach ($data as $entry) {
        if (isset($entry['time'])) {
            $timestamp = strtotime($currentDate . ' ' . $entry['time']);

            // Umrechnung der Zeit in die x-Position im 24-Stunden-Graphen
            $x = 50 + ($timestamp - strtotime($currentDate)) / (24 * 60 * 60) * ($width - 100);

            // Korrektur, um sicherzustellen, dass x im erwarteten Bereich liegt
            $x = max(50, min($width - 50, $x));

            $y = $height - 50 - (($entry['temperature'] - $minTemperature) / $temperatureRange) * ($height - 100);

            $values[] = $x;
            $values[] = $y;

            // Debug-Ausgabe
            # echo "time: {$entry['time']}, x: $x, y: $y<br>";
        }
    }

    // Zeichnen der Linie (offen) für den aktuellen Tag
    imagesetthickness($img, 2);
    if (count($values) >= 4 && count($values) % 2 === 0) {
        imageopenpolygon($img, $values, count($values) / 2, $lineColor);
    }


    // Vortag-Daten abrufen
    $yesterday = date("Y-m-d", strtotime($currentDate . " -1 day"));
    $sqlYesterday = "SELECT time, Innentemperatur FROM sensor_data WHERE date = '$yesterday' ORDER BY time";

    $resultYesterday = $conn->query($sqlYesterday);

    if ($resultYesterday->num_rows > 0) {
        // Daten für den Vortag sammeln
        $dataYesterday = array();
        while ($rowYesterday = $resultYesterday->fetch_assoc()) {
            $dataYesterday[] = array(
                'time' => strtotime($yesterday . ' ' . $rowYesterday['time']),
                'temperature' => floatval($rowYesterday['Innentemperatur'])
            );
        }

        // Beschriftung der y-Achse (Temperatur) für den Vortag
        $maxTemperatureYesterday = max(array_column($dataYesterday, 'temperature'));
        $minTemperatureYesterday = min(array_column($dataYesterday, 'temperature'));
        $temperatureRangeYesterday = $maxTemperatureYesterday - $minTemperatureYesterday;
        $yLabelFrequencyYesterday = $temperatureRangeYesterday / 10; // 10 Temperaturwerte auf der y-Achse

        for ($i = 0; $i <= 10; $i++) {
            $y = $height - 50 - ($i * ($height - 100) / 10);
            $label = number_format($minTemperatureYesterday + $i * $yLabelFrequencyYesterday, 1);
            imagestring($img, 3, $width - 40, $y + 5, $label, $axisColor);
        }

        // Temperaturwerte zeichnen für den Vortag (gestern)
        $valuesYesterday = array();
        for ($i = 0; $i < count($dataYesterday) - 1; $i++) {
            $x1 = 50 + (($dataYesterday[$i]['time'] - $dataYesterday[0]['time']) / (24 * 60 * 60)) * ($width - 100);
            $y1 = $height - 50 - (($dataYesterday[$i]['temperature'] - $minTemperatureYesterday) / $temperatureRangeYesterday) * ($height - 100);

            $x2 = 50 + (($dataYesterday[$i + 1]['time'] - $dataYesterday[0]['time']) / (24 * 60 * 60)) * ($width - 100);
            $y2 = $height - 50 - (($dataYesterday[$i + 1]['temperature'] - $minTemperatureYesterday) / $temperatureRangeYesterday) * ($height - 100);

            if ($x2 <= $width - 50) { // Zeichne nur, wenn x2 im Graphenbereich liegt
                $valuesYesterday[] = $x1;
                $valuesYesterday[] = $y1;
                $valuesYesterday[] = $x2;
                $valuesYesterday[] = $y2;
            }
        }

        // Zeichnen der Linie für den Vortag (gestern)
        $yesterdayColor = imagecolorallocate($img, 173, 216, 230); // Hellblaue Farbe
        imagesetthickness($img, 1);
        imageopenpolygon($img, $valuesYesterday, count($valuesYesterday) / 2, $yesterdayColor);
    }


    // Bild ausgeben
    header("Content-Type: image/png");
    imagepng($img);

    // Bildspeicher freigeben
    imagedestroy($img);
} else {
    echo "Keine Daten für den aktuellen Tag gefunden.";
}

// Verbindung zur Datenbank schließen
$conn->close();
?>
To keep this post concise and avoid the need for 7 additional code boxes, I have bundled all the files into a tar.gz archive for your convenience. You can download the entire collection of PHP files in a tarred package from this location. Download all the php files in a tarred package here.
If you are logged into your server via an SSH console, follow these steps:
wget https://www.wetransco.de/wp-content/downloads/climatemodule2/air-php.tar.gz
tar -zxf air-php.tar.gz
chmod -R 755 air-php
chown -R www-data:www-data air-php
cd air-php
Afterward, edit the IP address, dbuser, and dbuser’s password in each file to match your server’s setup. You can then either copy all the files to your document root directory or access your server’s website by opening your preferred browser and entering the following in the address bar.
https://YOU-SERVER-IP-ADDRESS/air-php
If all the steps were executed successfully, and you’ve updated the files with your credentials, configured the file permissions, and accessed the correct IP in your browser, you should encounter a webpage presenting your current and historical temperature values in a visually appealing format. In the upcoming segment of this module, we will construct a personalized weather forecast page. This will include data fetched from openweathermap.org using an API key, integrating your temperature recordings, incorporating real-time webcam views, and featuring a helpful weather forecast box for the next 5 days.